Category Archives: Inferential Statistics

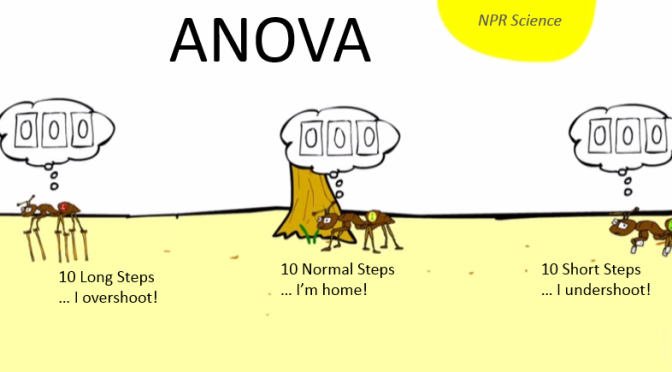
Udacity – Inferential Statistics – ANOVA – The Ants Count Example
Can Ants Count?
This example is taken from Problem Set 13 of the Udacity Inferential Statistics Course, one of my favorite. It compares the overshoot distance (in centimeters) of three different classes of sample groups (Ants with Short, Long, and Normal Leg length) using the ANOVA method, and see if the mean values of the three groups significant differ to each other. (A more detail description of the experiment to follow shortly.).
This short YouTube Video will set the scene nicely. It is awesome!
The Udacity Example
Desert ants have a nifty way of finding their way back home after a foray out of the nest to find food – they count their steps. To prove it, some scientists devised a creative experiment that showed just how the little guys do it. NPR’s Robert Krulwich and Odd Todd explain. Credit: Robert Krulwich, Odd Todd, Jason Orfanon.
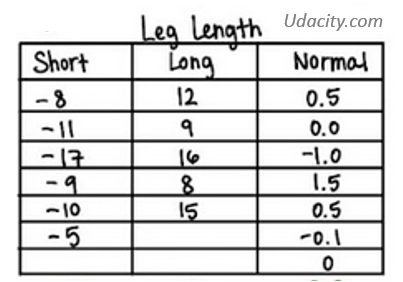
Let’s work with some fictitious data that is consistent with the study described in the video. The table below list how close (distance from next in centimeters) each ants got to their nest using either short-, long-, or normal-legs. (Positive distance mean overshoot. Negative distance mena undershoot).
The Question
Do the mean (distance) values of at least 2 groups of ants significantly differ to each other?
The Hypothesis
Null Hypothesis: none of the means are significantly diffrent to each other.
$$
H_{0} : \mathit{\mu_{short}} = \mathit{\mu_{long}} = \mathit{\mu_{normal}}
$$
Alternative Hypothesis: at least 2 of the means are significantly different to each other.
Spreadsheet Procedure
This entire ANOVA Hypothesis Testing Procedure can easily be performed in a spreadsheet. All fit in a page (Can you believe it!).
I have divided the spreadsheet into 12 chunks and will go through these chunks one after the other. In reality though the computation may be better off done by technologies / programming. I just thought a simple spreadsheet is not a bad medium for illustrating the concepts.

Step 1: Provide Raw Data
First of all, manually enter the (distane from nest in centimeters) values for each ant groups (short-, long-, normal-legs).
Step 2: Compute Group Summaries
For each group:
- Compute the sum:
$$
\mathit{X_{group}}= \sum_{group} \mathit{X}
$$
- Enter the Group Sample Size:
$$
\mathit{n_{group}}
$$
- Compute the Group Mean:
$$
\overline{\mathit{X_{group}}} = \frac{\mathit{X_{group}}}{\mathit{X_{group}}}
$$
Step 3: Compute Grand Summary
We now compute some “Grand” numbers that represent the entire sample (that contains $\mathit{k}=3$ number of groups with sample size $\mathit{n_{group}}$).
- The Grand Sum:
$$
\mathit{X_{grand}} = \sum_{allGroups} \mathit{X_{group}}
$$
- The Grand Sample Count:
$$
N = \sum_{allGroups} \mathit{n_{group}}
$$
- The Grand Mean:
$$
\overline{\mathit{X_{grand}}} = \frac{X_{grand}}{N}
$$
Step 4: Compute Within-group Deviation Squared
Compute the Within-group Deviation Squared, by taking the squared differenec between the raw data and the group mean.
$$
(X-\overline{\mathit{X_{group}}})^2
$$
Step 5: Compute the sum of Within-group Deviation Squared
For each group, sum all the Within-group Deviation Squared (from Step 4).
$$
\sum_{group} (X-\overline{\mathit{X_{group}}})^2
$$
Step 6: Compute the Within-group Sum-of-squares
$$
\mathit{SS_{withinGroup}} = \sum_{allGroups} \sum_{group} (X-\overline{\mathit{X_{group}}})^2
$$
Step 7: Compute More Group Summaries
Compute the Between-group Deviation Squared and muplitiply by the group sample size $\mathit{n_{group}}$:
$$
(\overline{X_{group}} – \overline{X_{grand}})^2
$$
Compute the overall Between-group Degree-of-freedom (for the $k=1$ groups):
$$
\mathit{dof_{betweenGroup}} = k – 1
$$
Compute the overlal Within-group Degree-of-freedom (for the $N$ populations):
$$
\mathit{dof_{withinGroup}} = N – k
$$
Step 8: Compute the Between-group Sum-of-squares
\[
\mathit{SS_{betweenGroup}} = \sum_{allGroups} (\overline{\mathit{X_{group}}} – \overline{\mathit{X_{grand}}})^2
\]
Step 9: Compute the Total Sum-of-squares
\[ \mathit{SS_{total}}=\mathit{SS_{withinGroup}} + \mathit{SS_{betweenGroup}}\]
Step 10: Compute the Sample F-Ratio and Critical F-Ratio
Compute the Mean Between-group sum-of-square:
\[\mathit{MS_{betweenGroup}} = \frac{\mathit{SS_{betweenGroup}}}{\mathit{dof_{betweenGroup}}}\]
Compute the Mean Within-group sum-of-square:
\[\mathit{MS_{withinGroup}} = \frac{\mathit{SS_{withinGroup}}}{\mathit{dof_{withinGroup}}}\]
Compute the F-ratio:
\[F=\frac{\mathit{MS_{betweenGroup}}}{\mathit{MS_{withinGroup}}}\]
Find the Critical F-ratio:
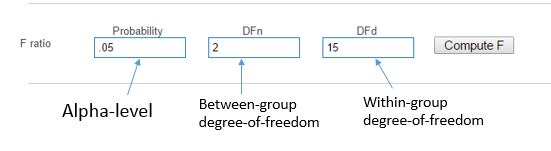
Go to GraphPad and compute the critical F-ratio $\mathit{F_{critical}}$.
Some notes:
- Assume an Alpha-level $\alpha$ of $.05$
- the Numerator (DFn) is the Between-group degree-of-freedom $\mathit{dof_{betweenGroup}}$
- the Denominator (DFd) is the Within-group degree-of-freedom $\mathit{dof_{withinGroup}}$.
- Hit the compute F button to find critical F-ratio!
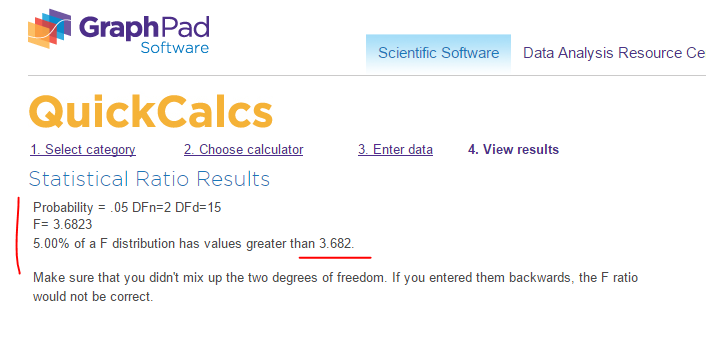
So the the critical F-ratio $\mathit{F_{critical}}$ is $3.682$.
Step 11: Make Statistical Decision – Reject or Retain Null?
We have:
Critical F-ratio $\mathit{F_{critical}}=3.682$ and F-ratio $\mathit{F}=74.18$
i.e.
$$
F \gt \mathit{F_{critical}}
$$
So we reject the NULL Hypothesis $H_0$. In otherwords, at least 2 of the means are significantly different to each other.
Step 12: Compute Eta Squared
the Eta-squared $\eta^2$ tells us the percentage proportion of the mean distance variance (dependent variable) is explained by the difference in leg length (independent variable).
$$
\eta^2 = \frac{\mathit{SS_{betweenGroup}}}{\mathit{{SS_{total}}}}
$$
In our spreadsheet example, we have $\eta^2 = 0.91$. In otherwords, we believe 91% of the dependent variable, is explained by the independent variable.
Conclusion
We have summarized the use of ANOVA via the Ants Count example. Given three or more groups of samples, ANOVA is a quick way to find out if at least two of the group means are significantly different to one another. We have presented the procedure via a spreadsheet, which may also be done by other technologies. The intuition is that, if $F$ is greater than $\mathit{F_{critical}}$, we reject the Null hypothesis. Otherwise we retain the Null.
Udacity – Inferential Statistics – Hypothesis Testing – T-statistics – Paired and Independent Samples – The Keyboard Example
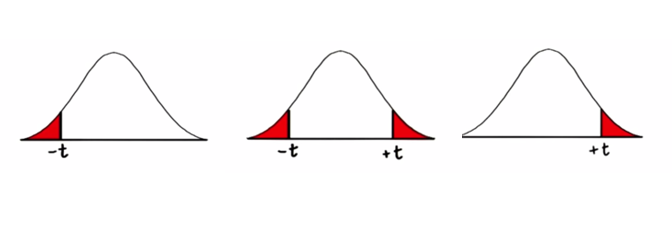
Udacity – Inferential Statistics Hypothesis Testing – One-tail or Two-tails?
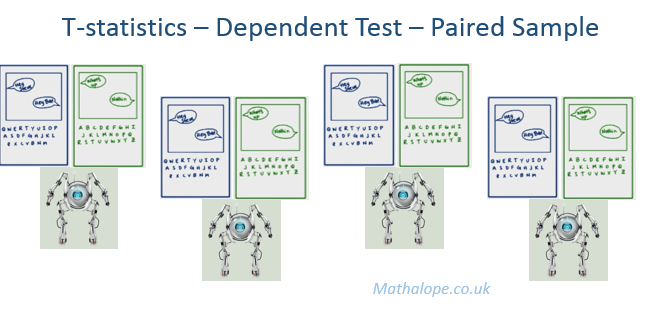
Udacity – Inferential Statistics – Hypothesis Testing – Dependent T Test for Paired Samples – The Keyboard Example
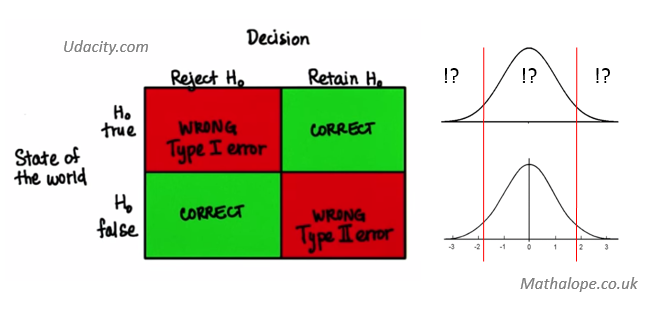
Udacity – Inferential Statistics – Hypothesis Testing – Decision Errors

Udacity – Inferential Statistics – The Hypothesis Testing Song
Have just finished the Udacity Inferential Statistics Hypothesis Testing class taught by Katie Kormanik, who has wrapped up the lesson with an awesome Hypothesis Testing Song.
(Or alternatively, this Udacity Link)
Couldn’t helped myself, I replayed the song a few time and wrote down the lyrics! (And… sang along :)
Here we go.
Hypothesis Testing
By Katie Kormanik
(This goes out to all my students from around the world…)
So you got
Some sample means
X bar is five
n is size seventeenIs it typical
Whatcha gotta know?
For the Sampling Distribution
is the way to go.You got the Samp-ling Dis-tri-bu-tion.
Oh na na na
So you got
Some populationMu is one
Sigma two
You’d need the derivation
for the Standard Deviationneed motivation
it’s as simple as Pi.
Sigma divided by square root n
Why?Cos it’s the Central…
Limit theorem…Now find your Z
Substract the mean
and divide by S.E.
What’s the probabilityIt’s not alot
Less than Alpha level you
REJECT H.0.!